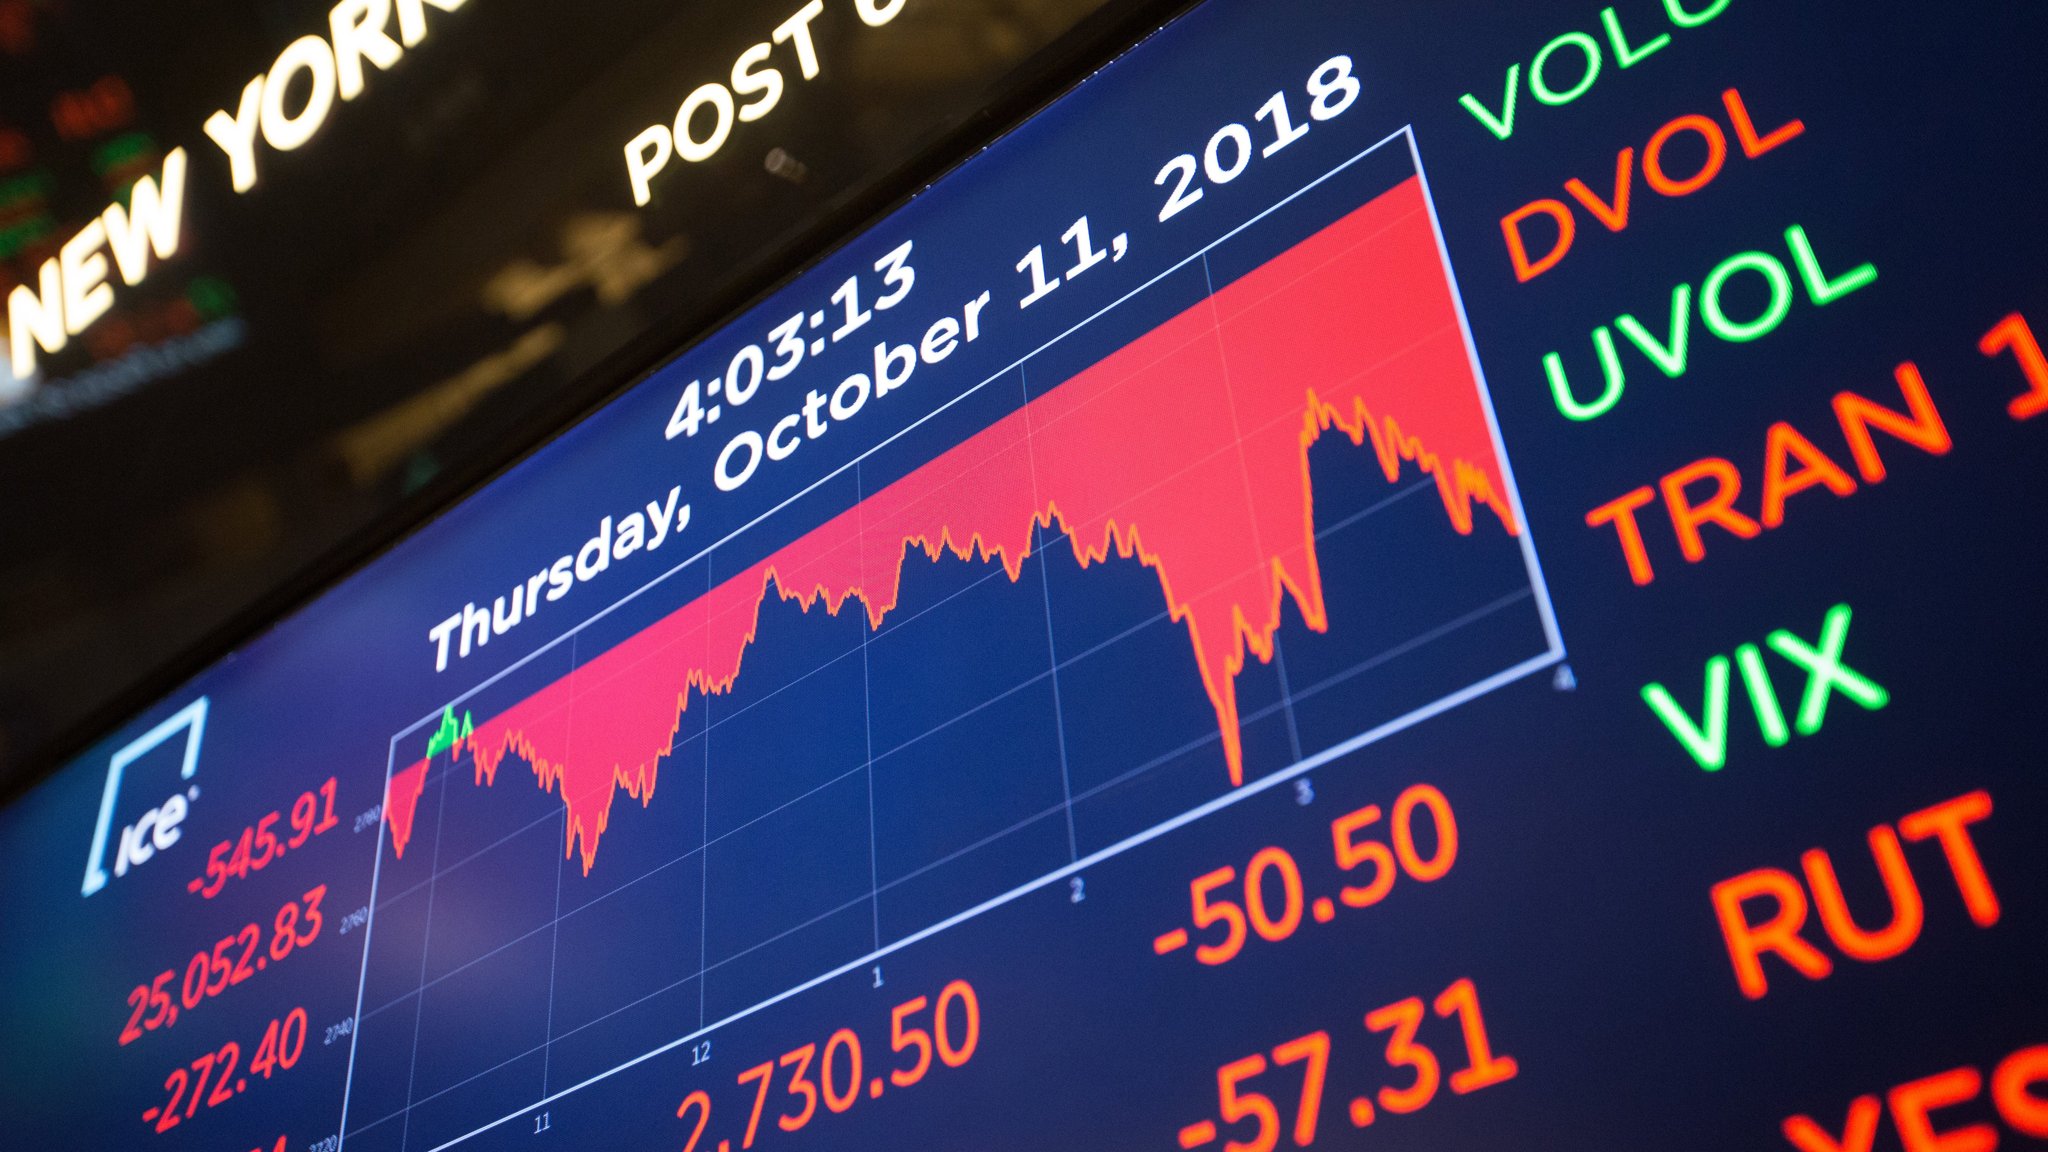
New York Stock Exchange data
Using spreadsheets, I have created a dynamic dashboard which gives profit and loss statements,financial model and forecasting model for all the companies from the data set.

Data Analyst | Business Analyst

Data Analyst | Business Analyst
Analyzing and visualizing data to make better and
informed business decisions.
A qualified engineer who is passionate about learning and solving critical problems, currently undergoing an extensive training program with Masterschool to be a successful Data Analyst. I am an optimistic analyst who believes that data analysis can change people’s lives for the better.
Well-versed in topics like Business Analytics tools, metrics and KPIs, Analysing and visualising the data using Tableau, Analytics with spreadsheets, Fluent with SQL and Python for data science.
"Give me six hours to chop down a tree and I will spend the first four hours sharpening the axe" -Abraham Lincoln.

Using spreadsheets, I have created a dynamic dashboard which gives profit and loss statements,financial model and forecasting model for all the companies from the data set.

Project is designed to tell a story using interactive dashboards on Tableau that highlights patterns in the dataset which reveal insights about US flight delays and cancellations.

In this project, I used Python to explore data related to bike share systems for three major cities in the United States—Chicago, New York City, and Washington. I wrote the code to import the data and answer interesting questions about it by computing descriptive statistics. I also wrote a script that takes in raw input to create an interactive experience in the terminal to present these statistics.

The data analysis team at ForestQuery has obtained data from the World Bank that includes forest area and total land area by country and year from 1990 to 2016, as well as a table of countries and the regions to which they belong. I have used SQL to bring these tables together and to query them in an effort to find areas of concern and the areas that present an opportunity to learn from successes.

E-commerce platforms like Unicorn allow people to buy products online. Tableau is used to perform exploratory data analysis and to create a dashboard that present the finding in a dynamic way.

Spreadsheets is used to create a dashboard to visualize the data and find interesting insights, weak areas and opportunities for Unicorn to boost business growth.